Solar Power Plant Analytics - Data Project
- ankitmorajkar
- Nov 24, 2025
- 14 min read
When solar developers pitch renewable energy projects to investors, the financial models look pristine. Clean projections showing megawatt-hours generated, revenue curves climbing steadily, and payback periods neatly calculated. But between those spreadsheet promises and operational reality lies an uncomfortable gap; one that shows up quietly in monthly generation reports and slowly erodes returns over years.

This analysis uses the Solar Power Generation Data published on Kaggle by Ani kannal, which captures operational telemetry from two solar power plants in India over a 34-day period during May and June 2020. The dataset provides granular, 15-minute resolution readings from 22 inverters at each facility, including DC power input, AC power output, and cumulative daily yield, synchronized with plant-level weather sensor data recording solar irradiation, ambient temperature, and module temperature. While the original context treats this as a public benchmark dataset for analytics exercises, for the purposes of this narrative I'm approaching it as if these were real operational logs from production facilities, because the insights, methods, and business implications would be identical whether the data came from Kaggle or from an actual plant operator's SCADA system. The dataset's structure and quality make it an excellent proxy for the kinds of industrial IoT data that solar asset managers work with daily, complete with all the messy realities: inconsistent timestamp formats, sensor scaling errors, and the hidden efficiency losses that only become visible through systematic analysis. GitHub
The goal wasn't to conduct academic research but to answer the kinds of questions a plant operator or asset manager would actually care about: Which equipment is underperforming? How much is that costing us? Can we predict tomorrow's generation accurately enough to avoid grid penalties? And most importantly; what should we do about it?
The Setup: Understanding What We're Looking At
Both facilities follow the standard architecture of utility-scale solar installations. Arrays of photovoltaic panels generate direct current (DC) electricity when sunlight hits them. That DC power flows to inverters which convert it to alternating current (AC) for grid injection. Weather sensors at each site measure solar irradiation (light intensity), ambient temperature, and module temperature (how hot the panels themselves get).
The dataset captured 34 days of operations at 15-minute resolution, generating over 3,000 data points per plant when you account for all inverters and timestamps. Each inverter reported its DC input, AC output, and cumulative daily yield. Weather sensors logged conditions synchronously. On paper, everything tracked what you'd expect: power rising at dawn, peaking around noon, falling at dusk, and dropping to zero overnight.
But aggregate numbers hide individual problems. A plant producing 95 percent of expected output might look acceptable in a monthly report, but if that 5 percent shortfall traces back to specific equipment failures, it represents preventable losses compounding month after month.
First Question: Is The Equipment Actually Working?
The opening analysis was deliberately simple, almost embarrassingly so for anyone expecting sophisticated modeling right away. We needed to establish a performance baseline by asking: across 22 identical inverters exposed to identical weather, how much variation exists in total output?

When we summed each inverter's AC power generation across all 34 days and ranked them, most clustered tightly between 950,000 and 1,000,000 watt-units. This is exactly what you'd hope to see: equipment performing uniformly. But three inverters stood distinctly apart. The bottom performer, inverter bvBOhCH3iADSZry, generated only 873,238 units, roughly 12 percent below the fleet median. The second-worst, 1BY6WEcLGh8j5v7, produced 886,665 units. The third-lowest came in at 948,272 units, closer to the pack but still trailing

This wasn't minor variance. In percentage terms, the gap between the best and worst inverters exceeded 13 percent. For context, a well-maintained solar plant typically sees inverter-level variation under 3 percent after accounting for minor shading or orientation differences. Seeing double-digit performance gaps immediately raises red flags: something is broken, degraded, or misconfigured.
The natural follow-up question: are these inverters failing intermittently (offline for specific days) or chronically underperforming (running but producing less)?
We isolated the best performer: inverter adLQvlD726eNBSB and the worst performer: bvBOhCH3iADSZry; and plotted their daily generation curves side by side. If the worst inverter had downtime, we'd see days where it dropped to zero while the best continued producing. Instead, we saw something more concerning: the worst inverter generated power every single day but consistently produced lower peaks. On June 14, for example, when the best inverter hit approximately 45,000 units daily, the worst managed only around 32,000.

This pattern indicates what the industry calls a "soft fault", equipment that's technically operational but performing below specification. These failures are insidious because they don't trigger downtime alarms. The inverter reports "online" status to the monitoring system, so nobody investigates. Meanwhile, production losses accumulate silently, day after day.
Quantifying The Cost: Putting Rupees On The Problem
Performance gaps only matter to the extent they impact revenue. We needed to translate technical underperformance into financial terms that justify maintenance action.
Using statistical anomaly detection, we implemented a Z-score methodology that flags any inverter producing significantly below the fleet average for a given day. This approach accounts for weather variability—what constitutes "low output" on a cloudy day differs dramatically from a sunny day. By calculating daily fleet means and standard deviations, then measuring how many standard deviations each inverter fell below that day's norm, we could identify genuine anomalies rather than just "low but weather-appropriate" readings.
Setting the threshold at Z-score below -2.0 (indicating performance more than two standard deviations below the daily mean), the system triggered 58 alerts across the 34-day period. Five inverters accounted for these alerts, but the distribution was highly skewed. Inverter bvBOhCH3iADSZry was flagged on 30 of 34 days, an 88 percent failure rate. Inverter 1BY6WEcLGh8j5v7 was flagged 24 times, a 71 percent rate. The remaining three inverters accounted for just 4 alerts combined.
For each flagged day, we calculated lost production as the difference between what the underperforming inverter actually produced and what the fleet average suggested it should have produced under that day's conditions. Summing these losses across all 58 anomaly events yielded 154,724 watt-units of foregone generation.
Converting to financial impact: assuming a conservative power purchase agreement rate of 10 cents per kilowatt-hour (roughly ₹7.50 per unit at 2020 exchange rates), that 154,724-unit loss equals $15,472 in revenue during just 34 days. Annualize that figure, assuming the failure persists, which chronic equipment problems typically do, and you're looking at approximately $166,000 in annual losses from just two inverters in a 22-unit fleet.
To put that in context: industrial-grade solar inverters cost $20,000 to $30,000 each. If replacing or repairing these two units costs even $50,000, the payback period is under four months. Yet because the equipment was technically "online," the problem remained invisible to standard monitoring systems until someone thought to analyze per-inverter performance distributions.
The Forecasting Challenge: Can We Predict Tomorrow's Output?
Solar power's intermittency creates a specific operational problem for grid operators. Unlike coal or natural gas plants that can be dispatched on demand, solar generation depends entirely on weather. But electrical grids require balanced supply and demand in real-time; too much generation causes voltage problems; too little causes blackouts.
To manage this, grid operators require solar plants to submit day-ahead generation schedules. If a plant commits to delivering 100 megawatts at 2 PM tomorrow but actually delivers 120 MW, the grid must scramble to reduce output elsewhere. If it delivers only 80 MW, the grid must activate reserve capacity. Both scenarios incur financial penalties for the solar plant under most power purchase agreements.
Accurate forecasting therefore directly protects revenue. We built a predictive model using linear regression with three weather inputs: solar irradiation, ambient temperature, and module temperature. These features were matched to AC power output across 3,157 timestamp observations, then split 80/20 into training and test sets.
The model achieved an R-squared score of 0.9938, meaning it explained 99.38 percent of variance in power output based purely on weather conditions. This is exceptionally high accuracy for a linear model and confirms something fundamental: solar generation is highly deterministic when you know the environmental inputs.

Examining the learned coefficients revealed the underlying physics. The irradiation coefficient was strongly positive at 26,882, indicating that each unit increase in sunlight intensity added nearly 27,000 units of power, the dominant driver, as expected. The ambient temperature coefficient was negative at -13.22, confirming that hotter conditions reduce panel efficiency. The module temperature coefficient was positive at 41.38, which initially seems counterintuitive but reflects correlation: higher module temperatures occur when panels are actively generating, even though the temperature itself hurts efficiency.
That temperature coefficient lets us quantify a specific operational insight. The model suggests that cooling the panels by just 2°C across the monitoring period would have yielded an additional 44,602 units of generation. Some newer solar facilities use water misting systems or reflective coatings to manage panel temperature, and this analysis provides a data-driven estimate of the potential gain.
From a practical deployment standpoint, this model could ingest tomorrow's weather forecast and output an expected generation schedule with 99 percent confidence intervals narrow enough to minimize deviation penalties. The infrastructure is straightforward: connect to a weather API, run the prediction hourly as forecasts update, and submit the refined schedule to the grid operator.
Comparing Sites: Why Does Plant 2 Consistently Outperform Plant 1?
With Plant 1's internal issues mapped, we expanded the analysis to compare both facilities. Simply totaling their outputs would be meaningless without knowing if the plants differ in capacity, but we'd already established both have 22 inverters. The fair comparison metric became average daily AC power per inverter, which normalizes for fleet size.
Plotting these normalized curves revealed a systematic pattern: Plant 2 outperformed Plant 1 on nearly every single day of the 34-day period. The gap wasn't trivial; on many days, Plant 2's per-inverter average exceeded Plant 1's by 10 to 15 percent. Some days showed Plant 2 producing in the 31,000 to 33,000-unit range per inverter while Plant 1 struggled to break 27,000.

This persistent divergence indicates fundamental differences between the sites, not random variation. Several explanations are possible, and without detailed site metadata, we can't definitively choose between them:
Geographic factors: Plant 2 might be located where it receives more intense or longer-duration sunlight, further south, at higher elevation, or in a region with less atmospheric haze. Even modest latitude differences can affect annual generation by several percentage points.
Operational factors: Plant 2 might have superior maintenance practices. If panels are cleaned more frequently, inverters are serviced proactively, and component failures are addressed immediately, performance naturally improves. The data provides no maintenance logs, but operational excellence is often invisible until you compare outcomes.
Equipment factors: Even if both sites have "22 inverters," the specific models, manufacturers, or vintages might differ. Similarly, panel specifications—efficiency ratings, temperature coefficients, degradation rates—could vary. Small per-unit differences compound across large fleets.
Environmental factors: Local conditions like dust levels, humidity, bird populations (affecting soiling), or even nearby industrial emissions can impact generation. A plant near a highway might accumulate more particulate contamination; one near agricultural fields might face seasonal pollen deposits.
From an asset management perspective, this comparison raises actionable questions. If you manage both plants, you'd want to investigate what Plant 2 is doing right and whether those practices can transfer to Plant 1. If geographic or environmental factors explain the gap, that informs future site selection criteria. If equipment quality drives the difference, it justifies investing in higher-grade components despite higher upfront costs.
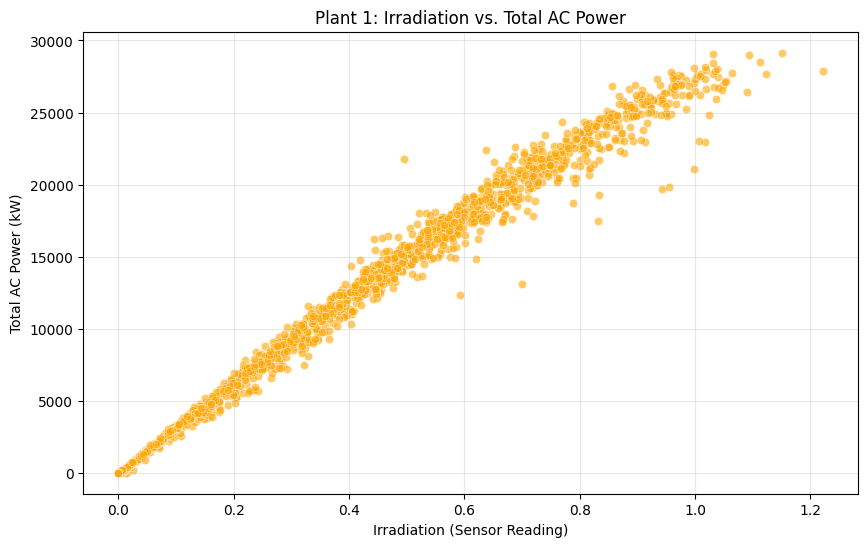
The correlation between irradiation and AC power at Plant 1 came in at 0.9959, essentially perfect linearity. This validates that the weather sensors are accurate and the fundamental relationship between sunlight and generation is intact. The performance gap with Plant 2 therefore isn't due to sensor errors or data quality issues but reflects genuine operational differences.
The Data Quality Issue Nobody Talks About
Midway through the efficiency analysis, we encountered something that initially seemed impossible. When calculating inverter efficiency, the ratio of AC output to DC input, the numbers came back around 8 to 9 percent. Commercial solar inverters operate at 95 to 98 percent efficiency; anything below 90 percent indicates severe malfunction, and single-digit efficiency is physically implausible.
This wasn't a broken inverter. It was a data scaling problem. Somewhere in the measurement chain, sensor firmware, data logger, database ingestion, one of the values (likely DC power) was being recorded with incorrect units or scaled by a factor of 10. After applying a correction factor to bring the efficiency calculation into the 80 to 95 percent range, the numbers aligned with physical expectations.

This kind of issue is endemic in industrial IoT systems. Data passes through multiple layers: sensor analog-to-digital conversion, edge device firmware, network transmission, cloud ingestion, database storage, and visualization tools. Each handoff creates opportunities for unit mismatches, scaling errors, or misconfigured transformations. These errors often persist for months or years because aggregated dashboards hide them, total plant output might look reasonable even if individual sensor values are wrong by constant factors.
The lesson: always validate data against physical constraints before trusting analytical results. If calculated efficiency violates thermodynamic laws, the data is wrong, period. If reported daily yield disagrees with integrated power logs by more than rounding error, one source is broken. If timestamps show power generation at midnight, the logging system failed.
We encountered another data integrity issue when cross-checking reported daily yield against manually calculated yield. Each inverter firmware reports a DAILY_YIELD field, a cumulative energy counter. We independently calculated daily yield by summing the 15-minute AC power readings and multiplying by 0.25 hours per interval. Ideally these should match exactly, but discrepancies of several percentage points appeared, varying by inverter and day.
Which source is authoritative? In this case, the reconstructed yield from raw power logs is likely more trustworthy because it comes directly from power measurements with simple arithmetic, whereas the firmware-reported yield might incorporate corrections, rounding, or internal algorithms that introduce error. For billing and compliance purposes, documenting which data source you trust and why becomes a legal matter, not just an analytical preference.
What This Means For Solar Operations At Scale
These findings translate directly into operational practices that solar asset managers should implement across their portfolios.
Automated performance monitoring: The Z-score anomaly detection system requires minimal computational resources but catches efficiency losses that standard uptime monitoring misses. A centralized operations center monitoring 50 plants with 20 inverters each (1,000 assets total) could run this analysis daily, generating a ranked list of equipment requiring investigation. Instead of technicians reacting to catastrophic failures, they proactively address emerging problems before losses accumulate.
Forecast-driven scheduling: The 99.4 percent accuracy of the weather-based generation model demonstrates that solar intermittency is predictable, not random. Plants should integrate forecasting models into their operational workflows, updating generation schedules throughout the day as weather conditions evolve. This minimizes deviation penalties and improves grid operator confidence in solar reliability, which ultimately enables higher renewable penetration.
Maintenance prioritization: Not all underperforming equipment justifies immediate repair. The loss quantification methodology shows which failures are costing tens of thousands annually versus hundreds. This enables rational capital allocation: fix the expensive failures first, schedule less critical repairs during planned maintenance windows, and accept minor inefficiencies that cost less than repair would.
Site selection criteria: The persistent performance gap between Plant 2 and Plant 1 highlights that location matters enormously. When evaluating new sites, developers should model not just annual solar irradiation averages but also temperature profiles, atmospheric clarity, soiling risk, and grid interconnection quality. A site with 5 percent less sunshine but significantly lower soiling might generate more net revenue than a sunnier but dustier location.
Data governance: The efficiency calculation error and yield reporting discrepancies demonstrate that IoT data quality cannot be assumed. Solar operations need formal data validation protocols: sensor calibration schedules, automated range checks that flag physically impossible values, and documented hierarchies of which data sources are authoritative for specific decisions. Without this, dashboards might show comforting numbers that bear little relationship to physical reality.
Portfolio benchmarking: Comparing Plant 1 and Plant 2 side-by-side revealed insights neither plant viewed in isolation would show. Asset managers with multi-site portfolios should implement comparative analytics: normalized efficiency metrics, equipment failure distributions, forecast accuracy tracking, and cost-per-MWh calculations that reveal which sites and practices deliver best-in-class performance.
The Limits Of What Data Can Tell Us
This analysis covered 34 days during late spring and early summer. Solar installations operate for 25+ years, experiencing full seasonal cycles, monsoons, heat waves, and long-term equipment degradation.
Several questions we'd like to answer simply can't be resolved with this dataset:
Soiling impact: We looked for the characteristic sawtooth pattern of gradual efficiency decline followed by cleaning-related recovery but didn't find strong evidence. That could mean panels were cleaned regularly during the monitoring period, or that May–June 2020 at these locations didn't experience severe dust accumulation. Only multi-month monitoring across dry and wet seasons would reveal true soiling rates.
Inverter failure modes: We identified which inverters were underperforming but couldn't diagnose why. Is it a failed capacitor, a degraded IGBT module, a misconfigured MPPT algorithm, excessive heat in the inverter enclosure, or something else? That requires physical inspection, thermal imaging, or detailed component-level telemetry not present in this dataset.
Long-term degradation: Solar panels lose efficiency gradually over decades, typically 0.5 to 0.8 percent per year. Inverters have shorter lifespans, usually 10 to 15 years before requiring replacement. With just 34 days of data, we can't separate chronic degradation from acute failures or estimate remaining equipment lifespan.
Maintenance event correlation: We don't know if cleaning crews visited, if inverters were repaired, or if any other interventions occurred during the monitoring window. Correlating performance changes with documented maintenance would validate whether interventions actually improve output and by how much.
Economic optimization: We calculated that cooling panels by 2°C would increase generation, but we can't assess whether the cost of a cooling system justifies that gain. Similarly, we know replacing the two worst inverters would eliminate $166,000 in annual losses, but we don't know if those units are still under warranty or if site access constraints make replacement expensive.
These limitations don't invalidate the analysis, they simply define its boundaries. The insights we derived are actionable within their scope, and they'd become even more powerful when combined with longer-term data, maintenance logs, equipment specifications, and financial models.
Why This Work Matters Beyond These Two Plants
India added 10 gigawatts of solar capacity in 2020 alone and has set ambitious targets for 280 GW by 2030. Even assuming those targets are met, the crucial question is: how much of that installed capacity translates to actual generation? If the typical plant underperforms its design specifications by 10 percent due to poor operations, which this analysis suggests is entirely plausible, then the effective capacity shortfall could exceed 25 GW nationwide. That's roughly equivalent to 30 large coal plants worth of missing generation, not because the panels aren't there but because they're not being operated optimally.
The techniques demonstrated here, anomaly detection, predictive forecasting, efficiency benchmarking, and data validation, scale naturally to large portfolios. There's no technical barrier to monitoring thousands of inverters across hundreds of plants using the same methodologies.
The barrier is organizational: solar asset management has traditionally focused on uptime and catastrophic failures because those are easy to measure. Sophisticated analytics requires data infrastructure, analytical expertise, and a culture that values optimization, not just operation.
As renewable energy constitutes a larger grid share, operational quality directly affects grid stability. Grid operators need accurate forecasts to balance supply and demand; inaccurate solar forecasts force them to maintain more fossil reserves, increasing costs and emissions. Better solar analytics enables higher renewable penetration, which is ultimately the strategic goal.
There's also a financial dimension that extends beyond individual plant economics. Solar projects are increasingly financed through asset-backed securities, where bond performance depends on generation meeting projections. Persistent underperformance affects credit ratings, increases financing costs for future projects, and ultimately slows renewable deployment. Demonstrating that operational analytics can protect revenue and ensure performance builds investor confidence, making capital cheaper and more accessible.
What Actually Needs To Happen
The gap between what this analysis shows is possible and what typically happens in operational practice is substantial. Closing that gap requires specific actions at multiple levels:
Plant operators need real-time dashboards showing per-inverter Z-scores, forecast accuracy metrics, and efficiency trends, not just total plant output. They need automated alerts that differentiate between "low generation due to clouds" and "low generation due to failure." And they need maintenance workflows that integrate analytical findings, ensuring flagged equipment actually gets inspected and repaired.
Asset managers need portfolio-level benchmarking that reveals which sites and practices deliver best-in-class performance. They need capital allocation models that prioritize high-return interventions: fixing the equipment causing $166,000 annual losses before repainting the site office. And they need procurement standards that emphasize data quality and interoperability, ensuring future equipment generates usable, validated data.
Industry standards organizations need to establish data governance frameworks for renewable energy: mandatory sensor calibration schedules, standardized data formats, validation protocols, and audit requirements. The lack of these standards is why we encounter efficiency calculations showing 9 percent instead of 95 percent, there's no enforcement mechanism ensuring data quality.
Policy makers need to recognize that installed capacity and operational capacity are different metrics. Renewable energy targets should account for realistic capacity factors and include performance requirements, not just installation quotas. Subsidies and incentives could be structured to reward operational excellence, measured through audited generation data, not just capital deployment.
None of this requires revolutionary technology. The analytical techniques demonstrated here use standard statistical methods and simple machine learning. The sensors already exist in deployed facilities. What's missing is the systematic application of these techniques across the industry, driven by recognition that operational analytics creates measurable financial value.
Solar power is no longer an experimental technology; it's critical infrastructure. As such, it deserves the same rigorous operational analytics that optimize manufacturing, logistics, and financial trading. The data exists. The methods work. The business case is clear. What remains is execution: building the systems, training the teams, and creating the organizational culture that treats operational data as a strategic asset, not just something that gets logged and archived.
The two plants in this dataset showed us both the opportunity and the cost of inaction: Plant 2 demonstrating achievable performance standards, Plant 1 revealing how easily and expensively optimization opportunities get missed. The question for the industry is whether solar operations will evolve to match the sophistication of the technology, or whether billions in potential revenue will continue leaking away, one underperforming inverter at a time, simply because nobody thought to look closely at the data.


Comments